


RESTAURANT REVENUE GROWTH
Increase Sales, Retention and Profitability.
Optimize operational efficiency with digital tools that increase online orders, improve workflows, reduce manual tasks and help restaurants retain loyal customers while maximizing profitability across every channel.
We combine pricing strategy, menu engineering, automated marketing and customer data activation to drive measurable revenue growth in 60 to 90 days.
Revenue panel · live
LIVERevenue
+18%
Ticket
+9%
Direct
42%
The revenue engine
This is what selling more looks like, in data.
No fluff: every lever we pull shows up in your dashboard — channel mix, ticket, repeat rate and margin — on a 90-day plan.
Why it mattersWithout measuring channel mix, you can grow sales and shrink margin at the very same time.
Channel mix · month 3
The direct channel grows — and pays no commission.
Active levers
Avg. ticket
+9%
Repeat rate
+12%
Margin
+6pt
Orders
+24%
Measured against your baseline, not averages.
The 90-day plan
Days 0-30
Audit, recipe costing and pricing quick wins
Days 31-60
Direct channel + segmented campaigns live
Days 61-90
Mix optimization and ROI report
RESTAURANT TECHNOLOGY PLATFORM
Five Levers of Restaurant Revenue.
Connected systems that compound: more orders, larger checks, repeat guests, lower costs.
Order Volume Growth
Increase orders across direct, delivery and dine-in channels with targeted campaigns and visibility.
Average Ticket Lift
Menu engineering, upsell prompts and bundles that grow check size without hurting conversion.
Customer Retention
Automated loyalty, win-back and referral journeys that turn first-time guests into regulars.
Cost Optimization
Identify food cost leaks, labor inefficiencies and underperforming items with data-led insights.
Channel Performance
Optimize pricing and promos by channel to protect margin while growing top-line revenue.
MEASURABLE RESULTS
Real Outcomes Restaurants See.
+15% Avg. Ticket
Roc ‘N’ Ramen grew average check by 15%, roughly $120,000/year at full capacity.
+24% Orders
Multi-location concepts see 20–30% lift in direct orders within the first 90 days.
92% Retention
Activated guest databases produce industry-leading repeat visit rates.
−8% Food Cost
Menu engineering and waste analytics typically reduce food cost by 5–8%.
Recommended next step
AI Workforce™
Your AI team working 24/7 — calls, reviews, reports and follow-ups without hiring more staff.
Starting from$199/mo
Learn moreEND-TO-END RESTAURANT GROWTH SYSTEM
How We Drive Revenue.
- Restaurant revenue audit and opportunity sizing.
- Menu engineering and pricing strategy.
- Automated email, SMS and loyalty campaigns.
- Direct ordering optimization to reduce third-party fees.
- Channel mix and promo performance analytics.
- Weekly reporting with a dedicated growth lead.

FROM THE MAGAZINE
Related Resources
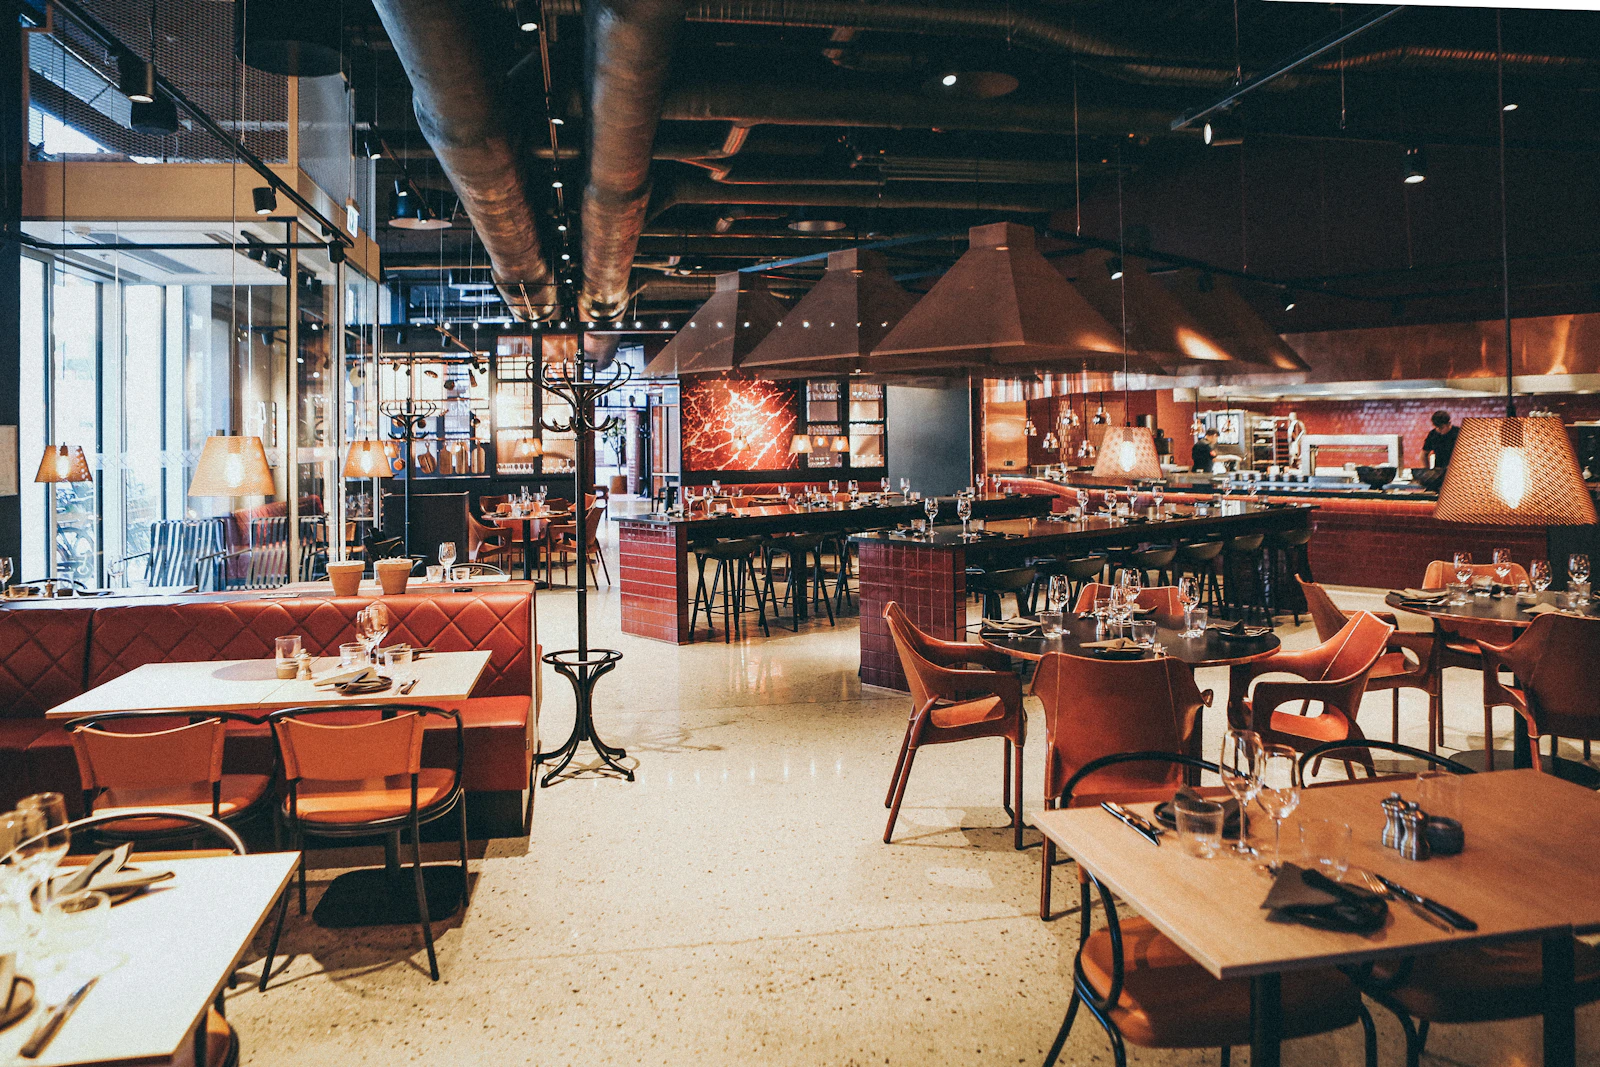
Case Study: How a 4-Location Operator Lifted Direct Orders 38% in 90 Days
A real European operator. Real audited numbers. The exact three changes we deployed in 90 days that moved a stalled multi-location group from flat year-over-year into compounding growth. No paid ads. No menu change.
Read article

Dynamic Pricing in Restaurants: When It Works, When It Backfires
Airlines did it. Hotels did it. Restaurants are now experimenting — clumsily, often. After running pricing experiments across 60+ venues, here is the operator's view: where dynamic pricing creates margin and where it destroys trust.
Read article

How to Cut Restaurant No-Shows by 40% Without Losing Bookings
No-shows quietly cost the average mid-market restaurant between €60k and €120k a year in foregone revenue. Here is the four-layer operating system we install — confirmations, holds, deposits and post-mortems — calibrated by venue type.
Read article
Continue exploring
Curious about pricing?
Compare all managed platforms